Economic cycles are part and parcel of any capitalist economies, and this is important as we invest. We have periods of strong growth, of reaching a pleateau, of periods of decline and periods of recovery. Economies have their cycle, and naturally materials (like rubber) and products also have their own cycle.
There are many strategies online regarding long-term investing, and one of the more popular ones will be dollar-cost averaging. We often hear people say, if you know nothing about investment, the safest way will be to dollar-cost average into S&P 500. Over time, it will surely make money. While that is true to some extent, it neglects the cost of time. We have a limited lifespan, and hence limited time to earn money. It makes a whole lot of difference whether we spend 1 year to make $10,000 or 10 years to make $10,000. In essence, we will want to improve our efficiency of earning money.
The Merrill Lynch’s Investment Clock is a simple chart giving a general guidance to long term investors on the suitability of investing in each asset class during various parts of the economic cycle. This chart is not meant to be difficult, but rather can be understood easily by the common man.
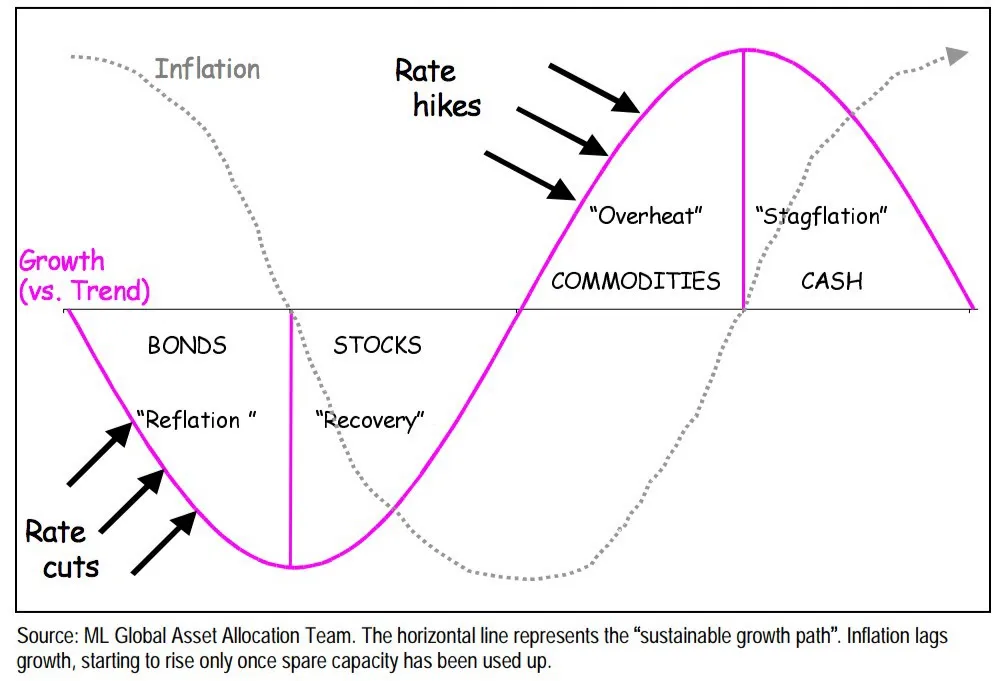
If we reorganise the above graph, we will have the following:
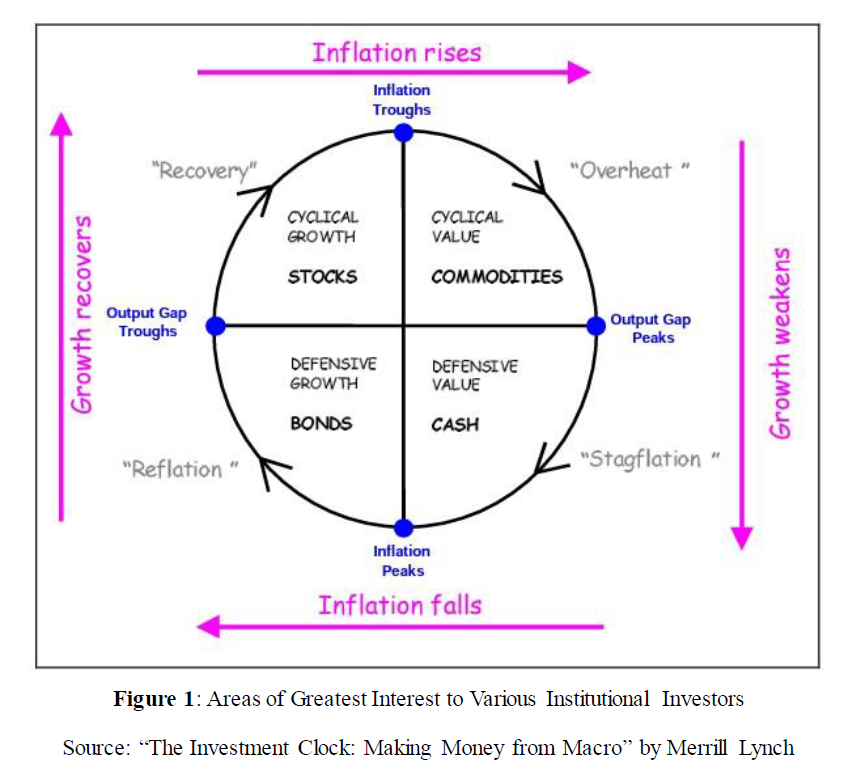
In summary, we have the following guide:
- During difficult times, buy bonds.
- In periods of economic recovery, buy stocks.
- When the market is overheated, buy commodities.
- When the market is stagnant, hold cash.
Let us look at a few examples in real life. We start from China.
Bonds
China’s economy has been bad for some time. The property bubble has burst. New graduates are unable to find jobs. People are lying flat because they see no hope. I had talked about this in the previous articles, so I will not repeat in detail again on why their economy was bad. However, we take note that the Chinese property bubble burst in 2021 and the economy was in shambles after that. We look below at the monthly chart of the yield of the China 10 Year Government Bonds and China 30 Year Government Bonds.
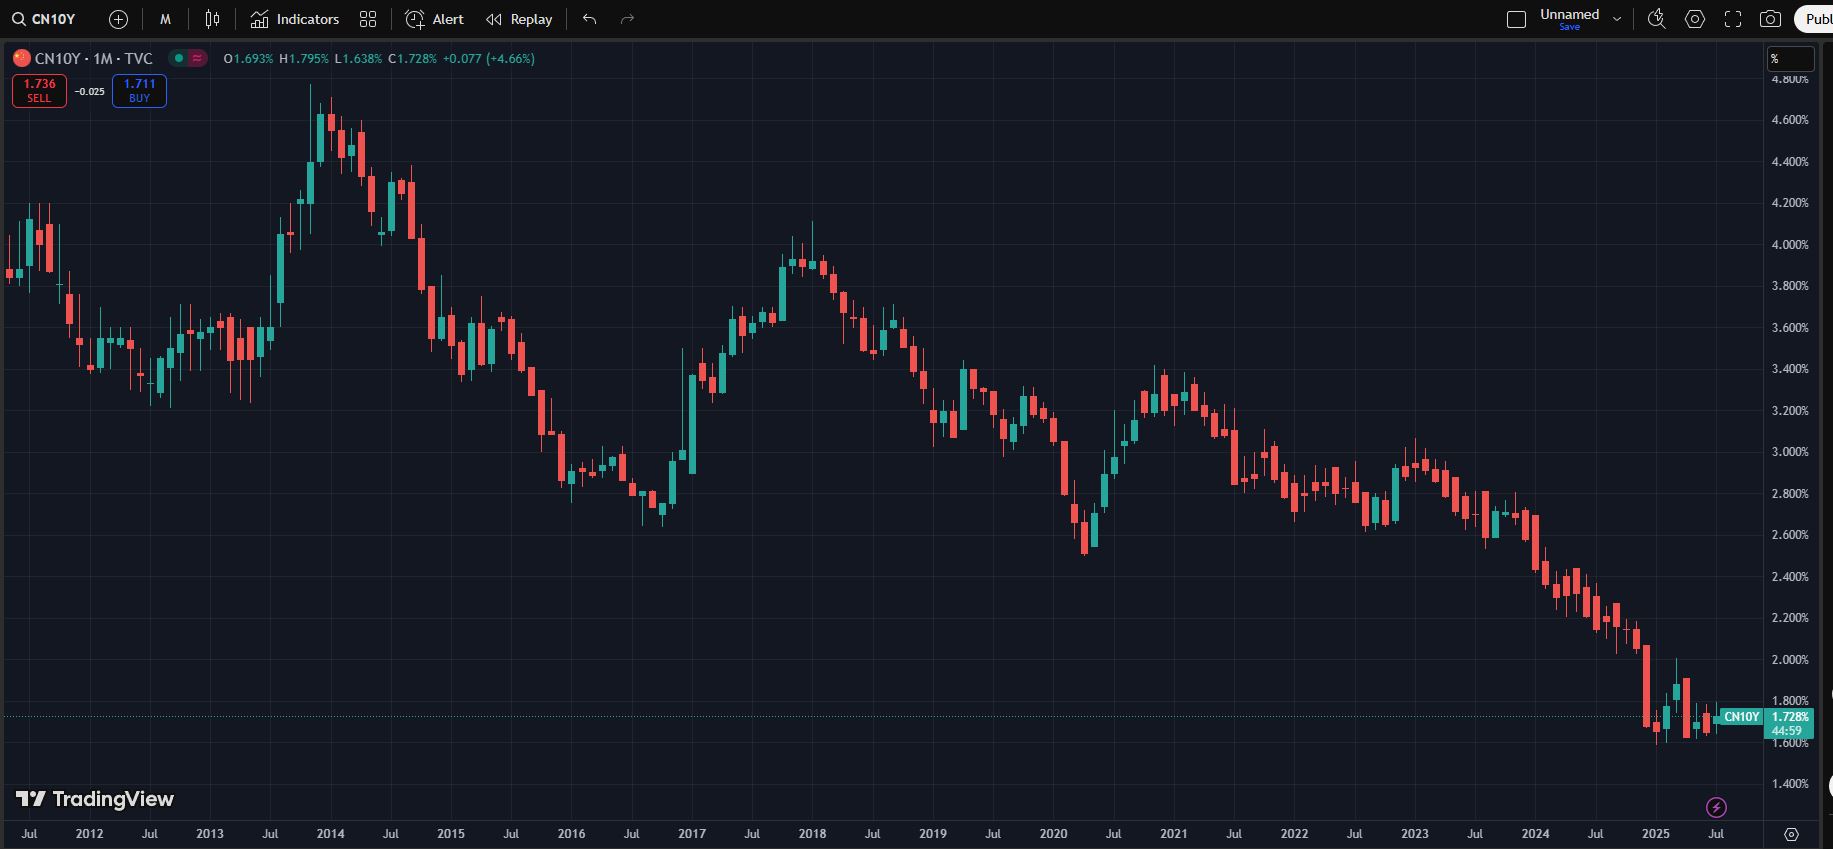
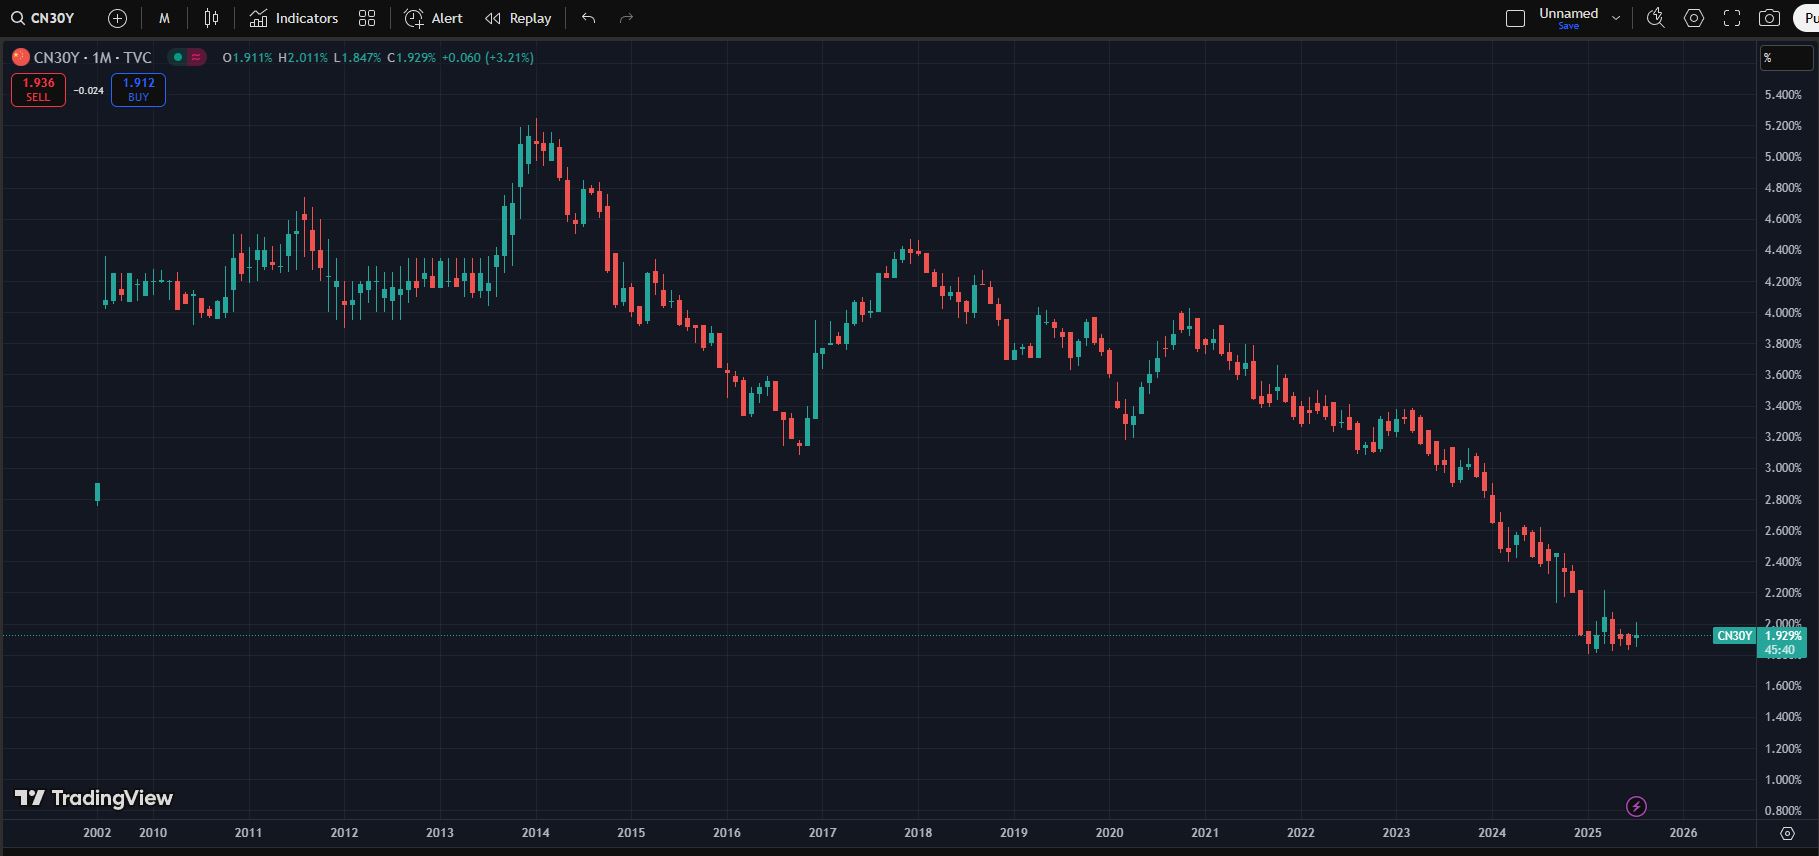
We see that the yield has been dropping since 2021. Take note that the price of bonds is inversely proportionate to the yield, so the ever-falling yield corresponded to the ever-increasing prices of bonds during the period from 2021 till now. That is to say, if you hold the bonds, the value of your bond will keep on increasing in price.
Stocks
After about 4 years, China finally dragged itself slowly out of the mud and is slowly recovering.
Now we look at their stock market, which has been dead and mocked at for years. As I had also mentioned earlier, the death of their property market also meant that their government has to prop up their stock market.
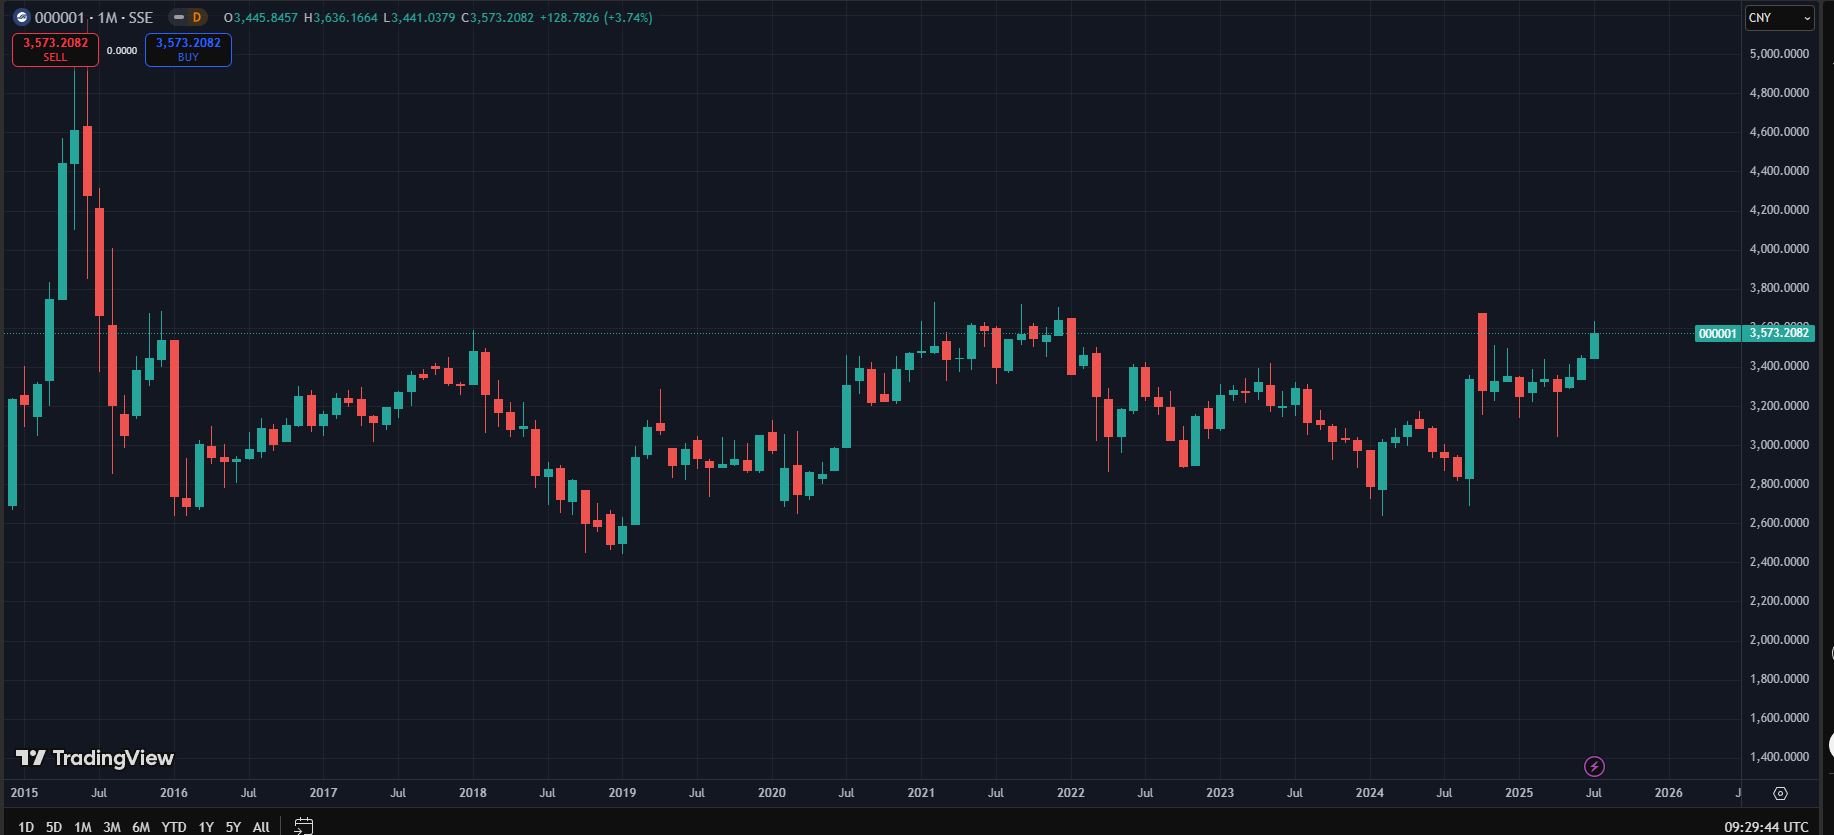
We look at the chart monthly chart of SSE Composite Index. From 2021 onwards the market was already dying and it fell to a low of near 2600 in 2024. But in recent times we can see a general uptrend. Do note that the trend is not too obvious as China is just beginning its recovery. But we should expect the stock market to perform well in time to come as China exits its recession phase and enters into recovery phase.
Commodities
The US stock market has seen a boom after the mass money printing by the US government. However, even today, the stock market is still going up, with the S&P 500 breaking new records and achieving new highs. Way before the stock market was being overheated, someone made a move to the commodities market.
In 2020, Warren Buffett made headlines for investing big monies into the top 5 Japanese trading houses – Mitsubishi Corp, Mitsui & Co, Itochu Corp, Marubeni Corp and Sumitomo Corp. From an initial stake of 5%, he has increased his shareholdings in all 5 trading houses to about 10% today. On the surface, it looks like Warren Buffett is buying stocks of company, but in actual fact he is dabbling with commodities. The earnings of the 5 trading houses are heavily exposed to commodities.
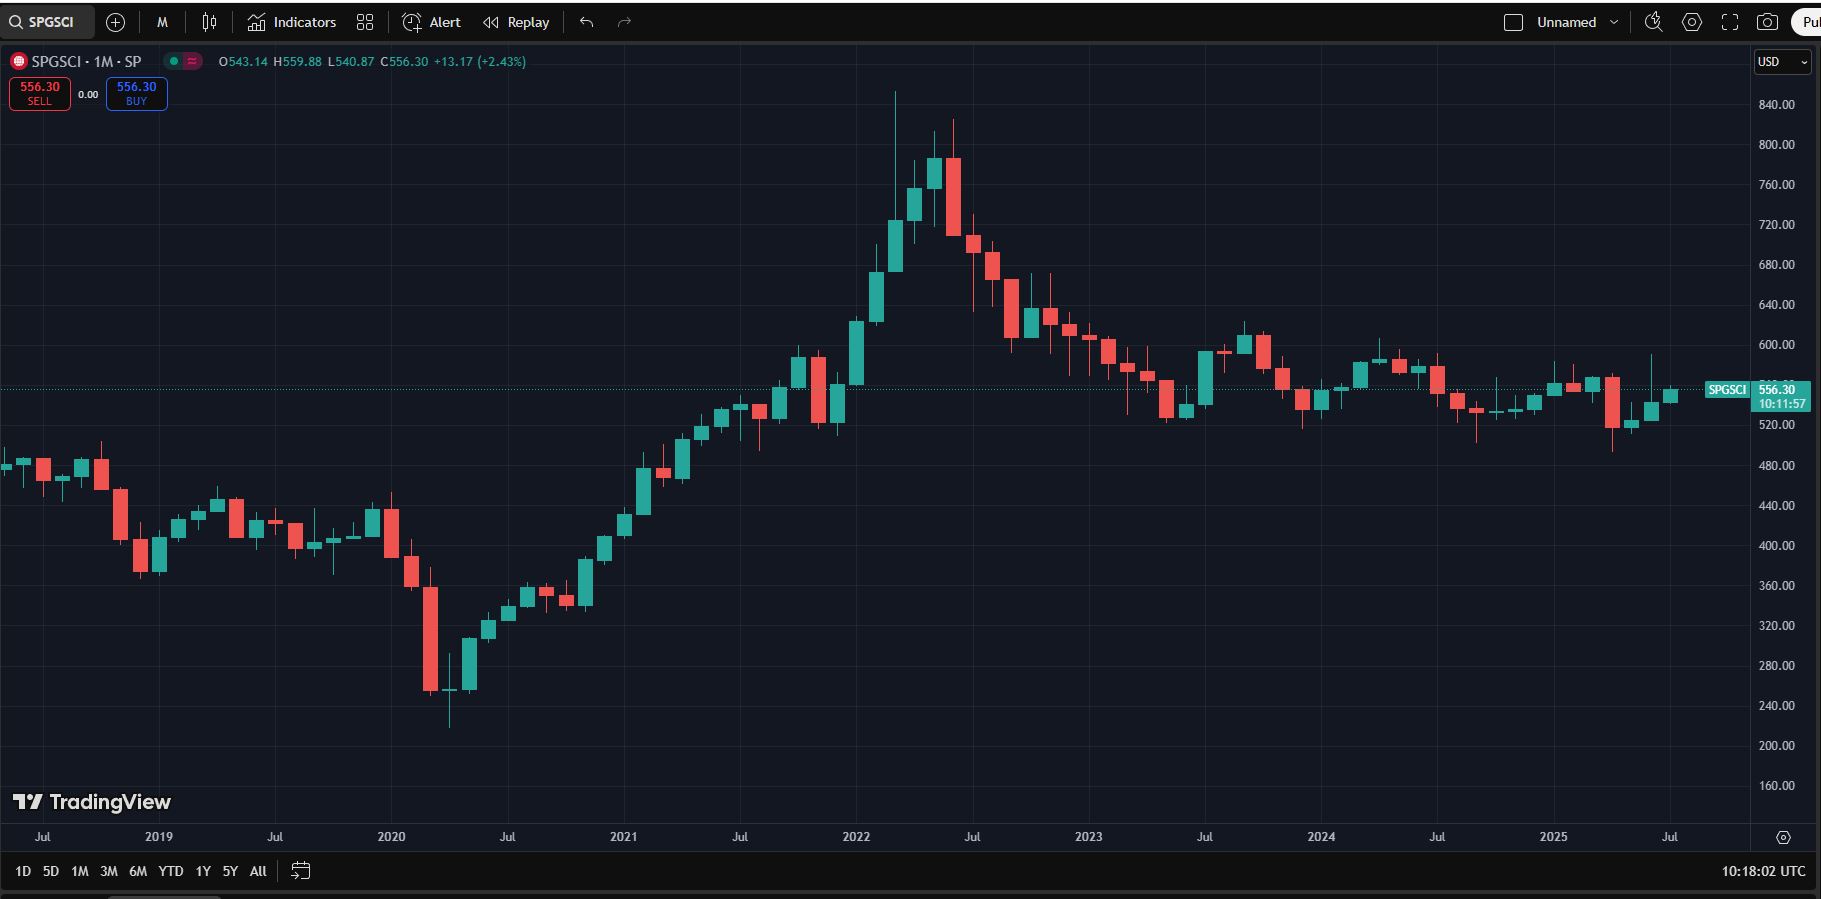
We look at the monthly chart of the commodities index – the S&P Goldman Sachs Commodity Index. Remember that Warren Buffett started buying into the trading houses in 2020 and increased his stake over the years?
Cash
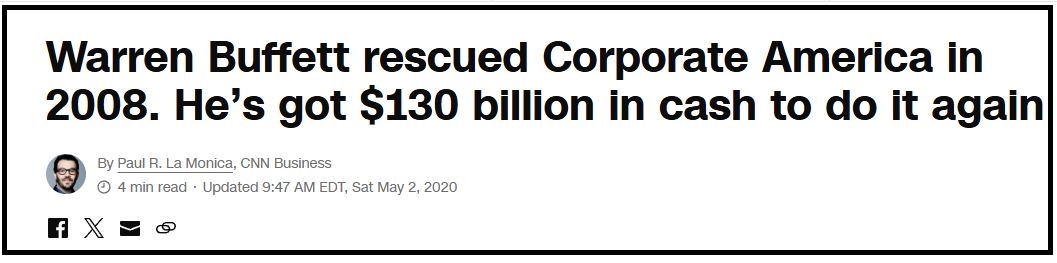
Straightforward. Warren Buffett has made news for stockpiling record amounts of cash. Economy is stagnant. In anticipation of a crash, he cleared off most of his stocks and is waiting for an opportunity to buy them back at a cheap price. But he would not appear as a cheapskate, but a hero using his cash to save the market in times of great need. A screenshot from the news 4 years ago. As of May 2025, Warren Buffett has 347.7 billion in cash.
What It Means For Us
There are a few lessons that we can take note of.
- Identifying the right stage of the economic cycle and investing in the correct assets will improve the efficiency of us making money.
- They say even a donkey can make money in a bull market. So as long as we identify and invest accordingly, we can be the donkey which earns money.
- While the chart shows a clear segmentation between the 4 parts of the economic cycle, take note that in reality it is often a gradual process and lines are blurred.
- From the chart we observed, that just because it is the recovery phase, does not mean only stocks will do well. Commodities will still rise, though not as fast as stocks. Bonds will still have a bit of leeway left. So while we take note of the stages of the economic cycle, there is no need to immediately dump one asset class for the other. But we should transit accordingly.
- We do not have the extensive network and team of analysts which the big banks and conglomerates have. But they are big and often have to buy and sell years months or even years in advance. Our advantage is that we are small, and we can enter and exit easily. So we should make use of that while referencing what the big monies do.
- Lastly, we should determine what is suitable for our portfolio. For example, in recovery phase, many people buy stocks which have high potential for capital gains. But that is not for me, and I prefer to buy dividend stocks. It may or may not be in line with the market, but whatever you buy, you should know what you are doing.
Showing 1 - 3 out of 3
Page 1 out of 1
| - | Shop Products | Price | |
|---|---|---|---|
|
|
 |
$99,999.00
|
|
|
|
|
$1.00
|
|
|
|
 |
Price range: $69.00 through $99.00
|