Big monies are disgusting. They play on double standards, and if they fail, there is always the governments to bail them out. They can manipulate the market, they can do insider trading, they can use their insanely huge financial power to twist the market in the direction they want. But if the commoners do that, the common people will go to prison. Everyone knows that, but there is nothing we can do.
That is why there is this phrase: If you can’t beat them, join them.
Today, we will look into the disgustingly rich and try to get a bowl of leftover porridge from their unwanted food.
The Commodity Futures Trading Commission (CFTC) collects and publishes data of the portfolio of the big monies weekly. The reports consist of trades by the big monies who trade on the American exchanges. The big monies include producers (for example gold producers), financial institutions, hedge funds, or even big individual investors who have holdings big enough to make it to the reporting criteria.
The data set consists of a wide range of trade items from coffee to cattle, metals (gold, copper) to forex, indices (S&P 500, NASDAQ 100) to energy (crude oil, natural gas). In fact, the dataset I use consists of 290 trading items, certainly a wide range for one to choose and play with.
The CFTC claims that the publishing of data aims to help the public understand market dynamics, which is essentially to help the public be an informed trader. The data is published in a text format, which looks something like this:
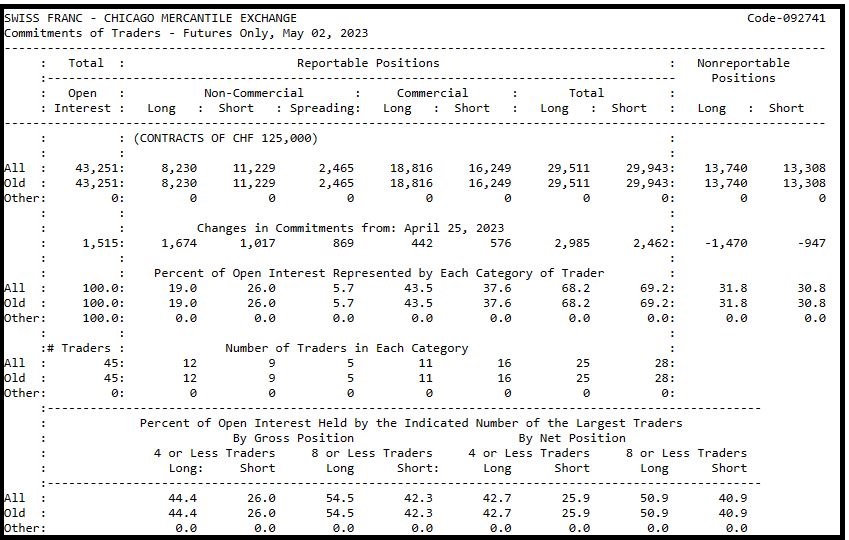
What each category means is up to one to find out, and I will not say it out here for reasons you will know later. But essentially, the CFTC is kind enough to give us the data. But you will also realise, while the data in the text file is easy to understand, it is not that easy to process. The comma delimited file will look something like this:
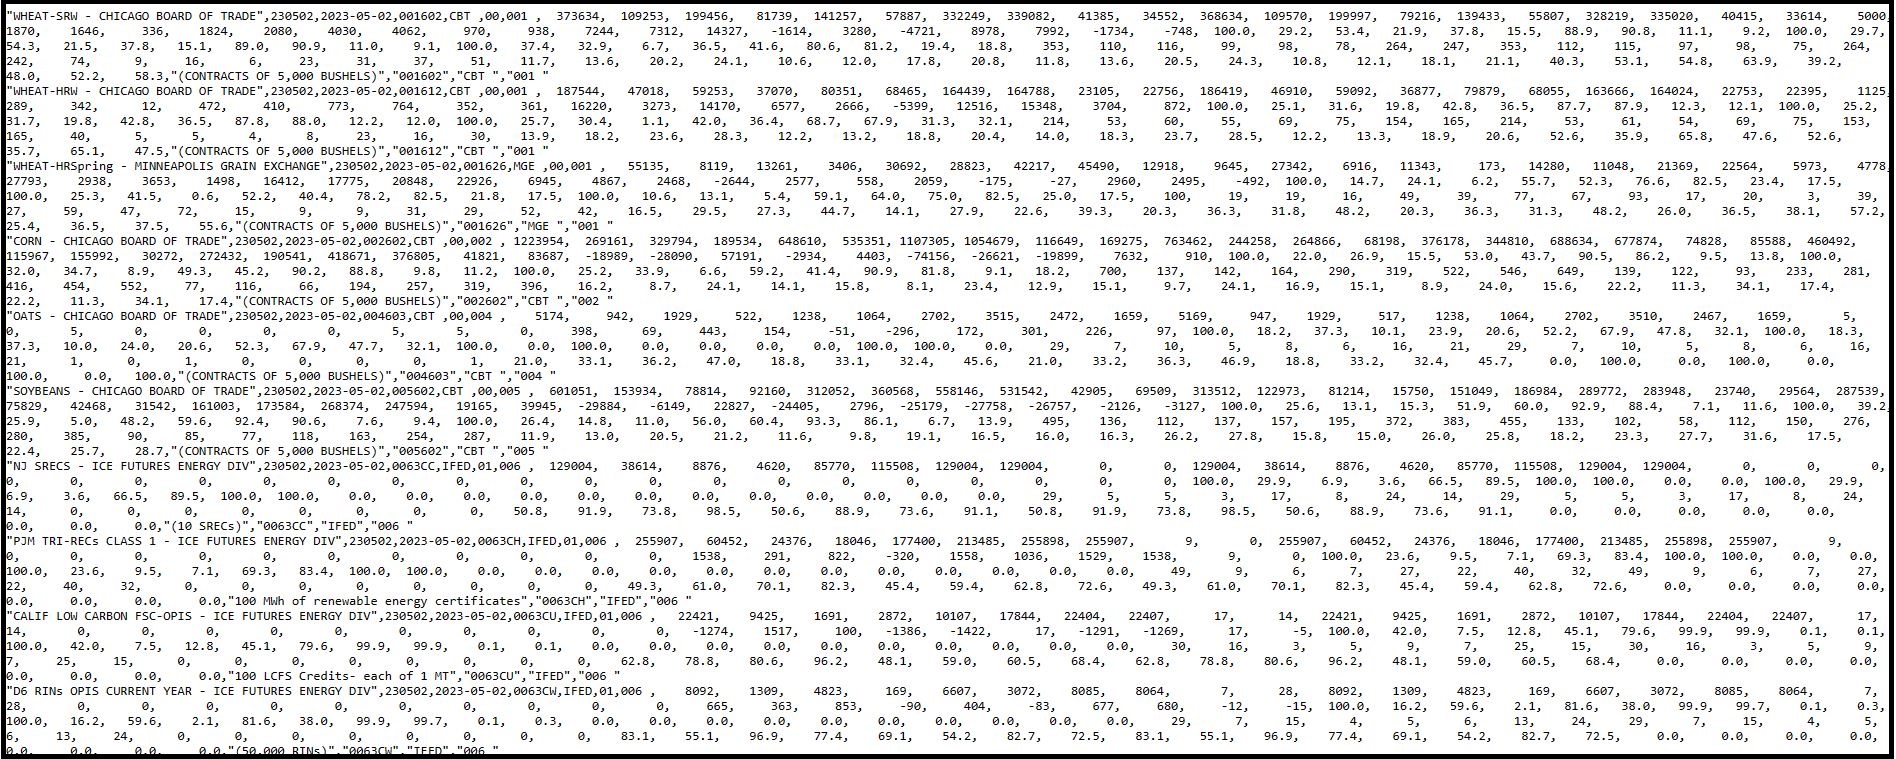
Unless one has basic data processing skills, one will not be able to turn this data into useful information. Manual processing can be done, but it will also take a great deal of effort. My point is this: that even though they publish the data, they have made it so that most of the common people will not be able to obtain much from it. Despite this, the CFTC is actually still doing the people a favour, because they bothered to publish and also provided a comma delimited file, which for people with the basic data processing skills, is a gift.
I said earlier that the CFTC is still doing us a favour, because the Traders in Financial Futures (TFF) Report by the European Securities and Markets Authority (ESMA), the Weekly Futures and Options Report (Australia) by the Australian Securities and Investments Commission (ASIC) and the Weekly Positions of Traders in Financial Futures (Japan) by the Financial Services Agency (FSA) no longer publish their weekly report. These few markets make up a significant portion of the trading activities. Luckily for us, the biggest of all, the US, currently still publishes the data. While what we have may admittedly be incomplete, it is the best we can do for now. Unless of course you have inside information.
How can the data help us? By allowing us to see what are the movements of the big monies. But first, we need to process and crunch through the set of huge data and summarise it in an easy to understand manner. I take the list of forex trading pairs to use as example:
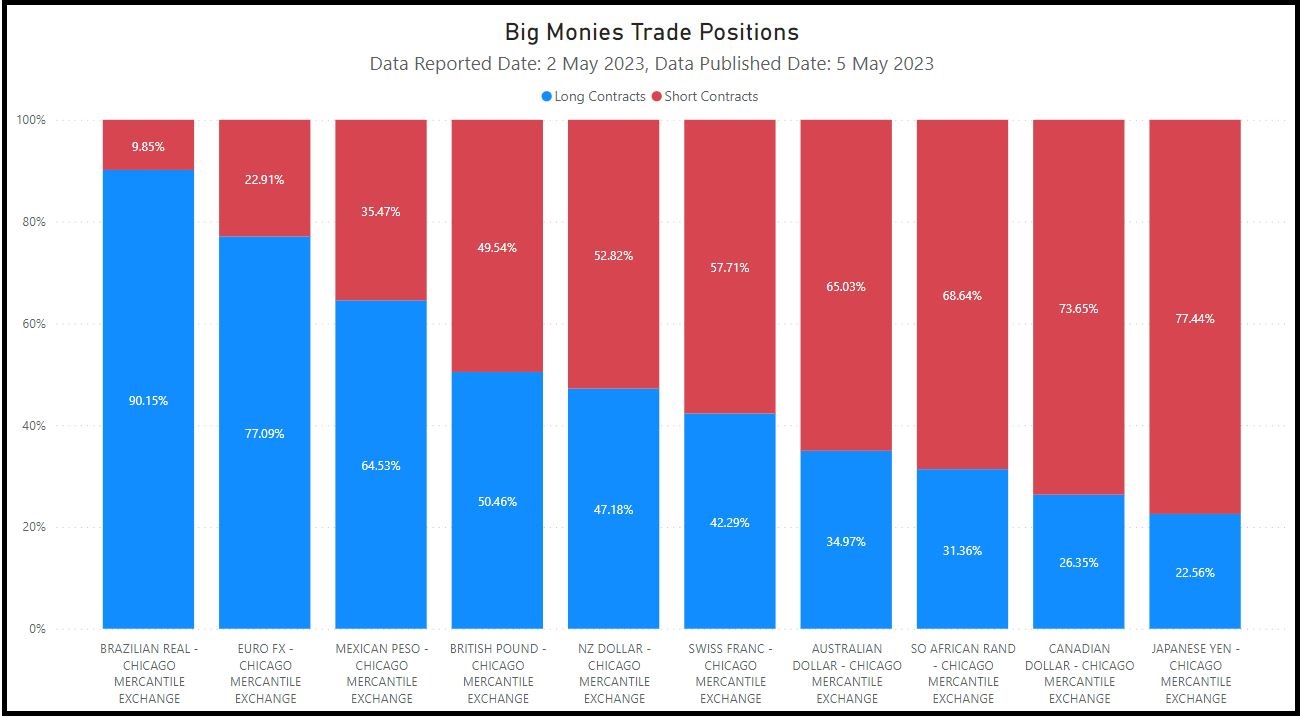
One look at this chart and we can see clearly which currency pairs are the big monies supporting and which they are shorting. At one look it seems to let us know what to trade. But of course, just like how we should listen to both side of people’s story when making a decision, it is the same when it comes to data. We should not just take it at surface value. Further analysing is needed. We quote another example:
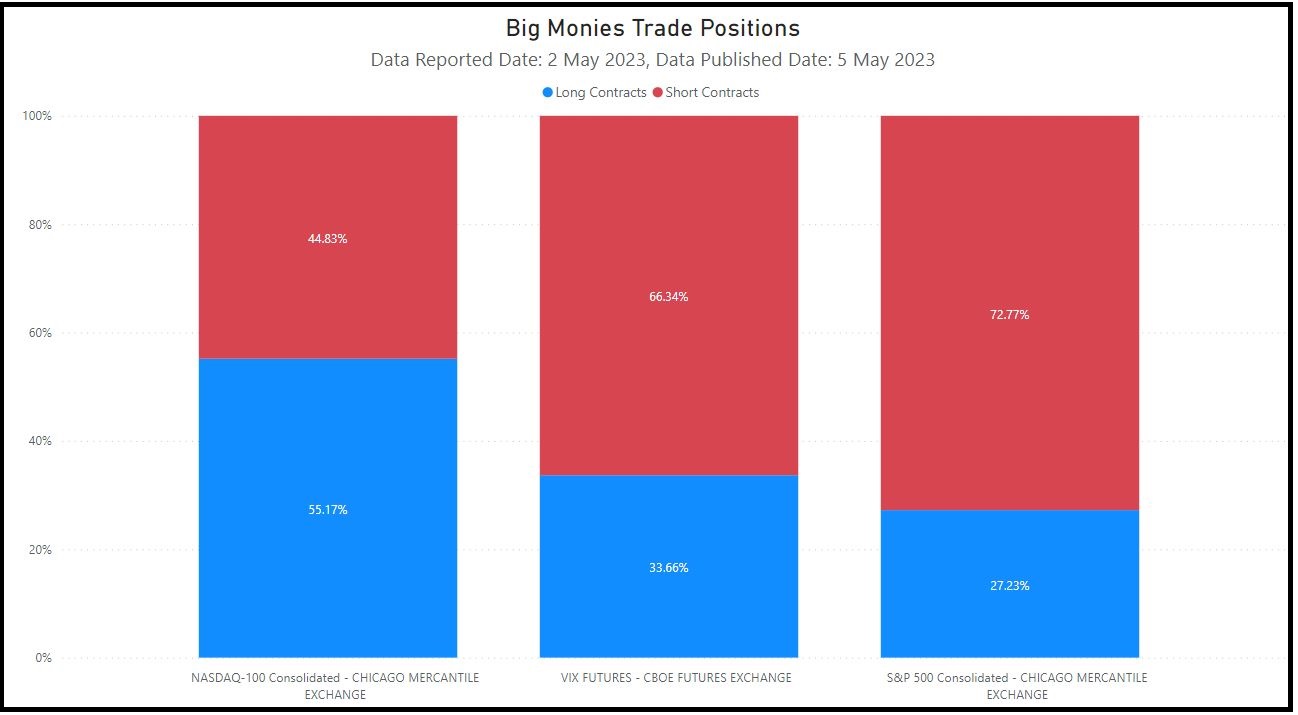
The chart above shows the indices portfolio of the big monies. We can see that the S&P 500 is heavily shorted. Just by judging from this graph, one may think that it is wise to join the big monies and short the S&P 500. But if we dig deeper, we will have this graph:
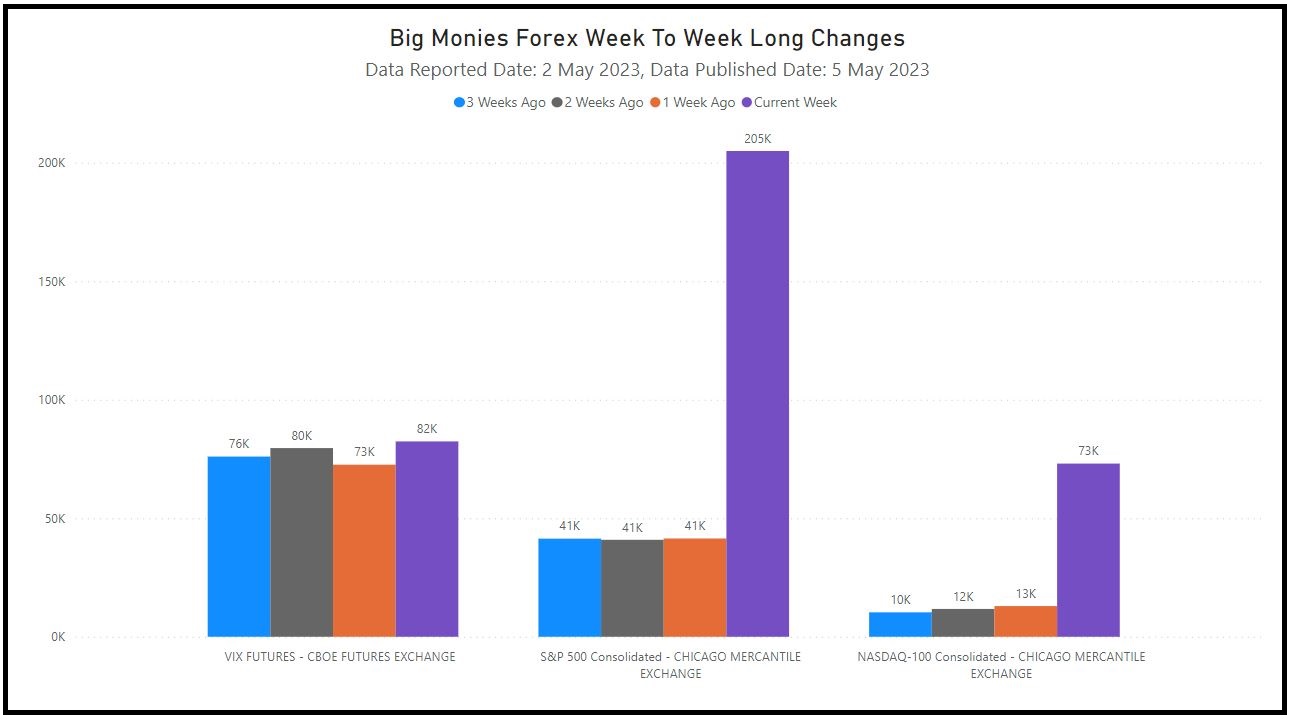
The above graph shows only the long contracts held by the big monies (the shorts are not included). We can see that there is a sudden spike in the long holdings of the S&P 500 by the big monies. Does that now change your decision a bit? Note that this is not financial advice, nor am I telling you to long S&P 500, afterall the majority of the big monies are still shorting it. What I am saying is that the data seems to show there might be a reversal in positions as more big monies now are going long.
Now we zoom out further and get another surprise:
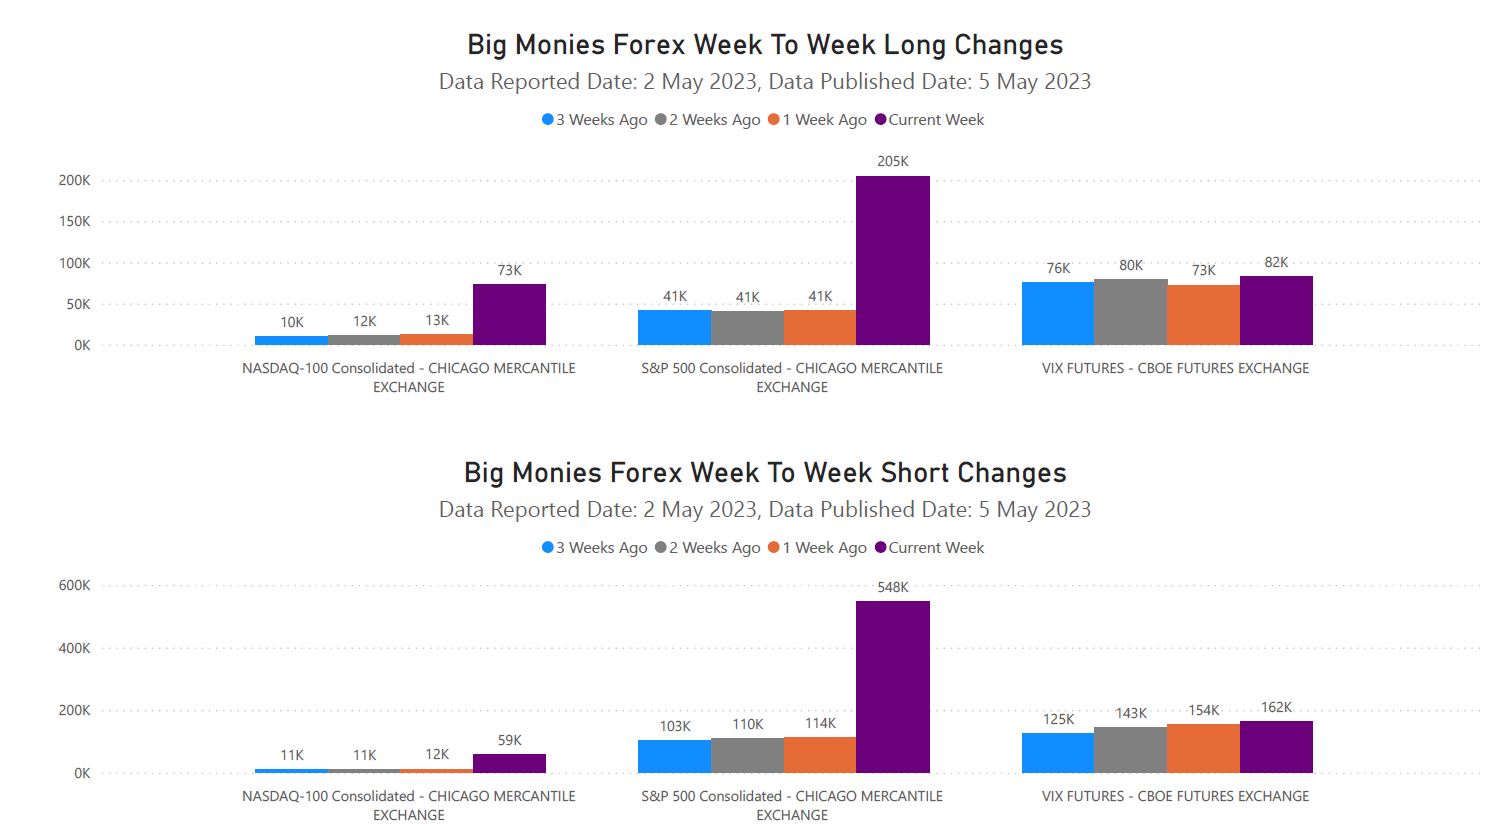
In my third post on copytrading, I talked about the psychology of trading. While we should continue to have the right mindset and do our homework diligently, the introduction of the above data certainly helps us in making better decisions. There is no 100% in trading, but as long as your wins are above your losses, you can be considered a winner.
Understand the rules of the game. Get as much resources (such as data, money) as you can. And finally be patient. Winnings are slowly accumulated over time. While there are those who earn big and quick, the risks are also big. While some succeed that way, many others failed.
Note: CFTC receives data submission every Tuesday and only publishes it every Friday afternoon (American time). So yes, there is some lag to the data. The good thing is, big monies need time to move and accumulate.
Showing 1 - 3 out of 3
Page 1 out of 1
| - | Shop Products | Price | |
|---|---|---|---|
|
|
$99,999.00
|
||
|
|
$1.00
|
||
|
|
Price range: $69.00 through $99.00
|


