I graduated with a degree in Statistics. I remembered once when doing a school project, I told my team leader: ‘Tell me the results you want and I will churn out the necessary statistics for you.’
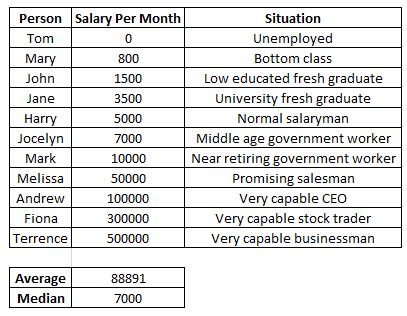
Statistics manipulation have been around with us all along. Things about data-driven statistics, about numbers-backed data, about charts not lying are simply just another tool to deceive the public. We take the picture below as an example:

From the above we have people across different social classes and capabilities earning varying amounts of money. While the median looks decent, the average is actually quite high, pulled upwards by the faraway upper class. The figures calculated above takes into account all of the inputs. But now if I tweak the definition a little, stating that I only take into account the working population instead of the whole population, I will remove the unemployed person to have a median of $8500 and an average of $97,780. But I look at it and find that the figures are too high, so I want to lower it. To do that, I change the definition yet again and only consider people who work for others, removing the stock trader and capable businessman as they are technically not employees. Now I have a median of $6000 and an average of $22,225. I will now present to the population that this is the median salary of the salaried employees and consider omitting the average salary aspect, which fit the situation of the common people.
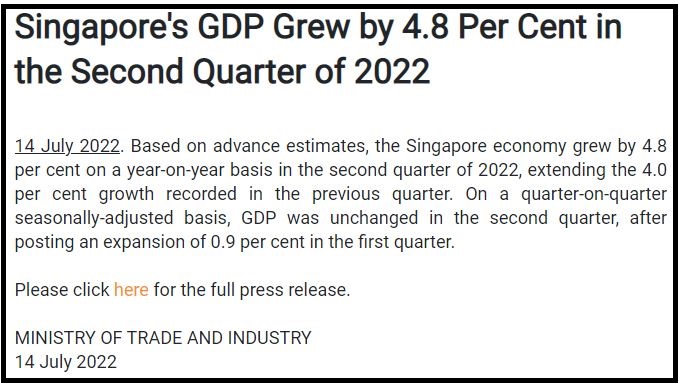
We now look at the real world example. Singapore’s official statistics showed that Singapore’s GDP grew by 4.8% in the second quarter of 2022.

We note that year on year GDP grew by 4.8%, but quarter on quarter there was no change. However, according to official statistics by the Monetary Authority of Singapore (think Central Bank of Singapore), we also have an inflation of 5% to 6% for everything.

By combining the 2 statistics from 2 different sources, we have the following: 4.8% GDP growth by the year with a minimum 5% inflation rate. If one does not piece the 2 together, one would have not have made the link, seeing how the figures came from different reports. In fact, many people would have fallen for the idea that GDP is indeed growing. Now that we have these 2 figures side by side, do you think that the overall output for Singapore has increased or has it shrunk?
Let us have an illustration for the benefit of some of our readers. GDP is also known as Gross Domestic Product, which is the total monetary or market value of all the finished goods and services produced within a country’s borders in a specific time period. To put it simply, it calculates the value of the total output of the country. We assume now that the country produces 100 bowls of noodles in a year, valued at $5 per bowl. Now due to an inflation of 20%, each bowl of noodle cost $6. But because of a recession, the country now only produces 90 bowls of noodle (10% reduction) due to lesser demand. Originally the GDP is $5 x 100 bowls = $500. Now we have a GDP of $6 x 90 = $540. We now have a 40/500 = 8% increase in GDP. But, has the actual output of the country risen? No, in fact the actual output has reduced. This is how we can report an increase in GDP in a period of recession.

As a commoner, what can we do with the information? If we know that a recession is coming, we should prepare accordingly. Find an alternative source of income as a backup, save up, cut down risky investments and get rid of your bad debts. It is too late to wait and regret with “if I had known“. You already know it now.
Statistics can be manipulated easily, and have always been that way to give people a misconception of things. Data-driven reports are not so driven by numbers, but by the will of the one presenting the report.
Showing 1 - 2 out of 2
Page 1 out of 1
| - | Resources | Price | |
|---|---|---|---|
|
|
$5.00
|
||
|
|
$1.00
|

